Températures journalières par rapport à la moyenne annuelle
avec flipbookr et xaringan
Ludovic Vigneron
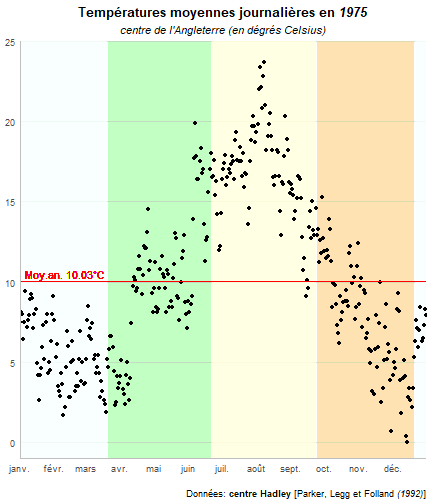
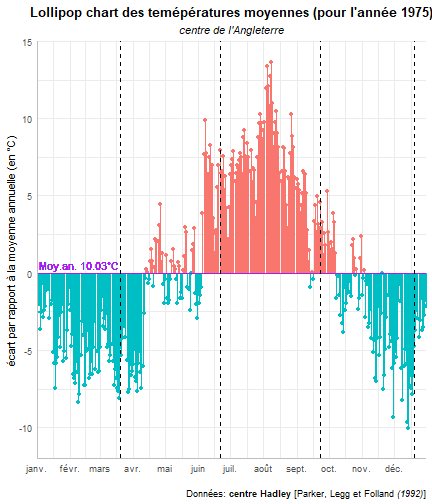
A partir des données du Hadley center, il s'agit d'établir une représentation des températures relevées chaque jours pendant une année sur une zone géographique (ici le centre de l'Angleterre) permettant de mettre en relief leur différence avec la moyenne calculée sur cette même année.
- Charger et mettre en forme les données
- Créer un graphe de type nuage de point
- intégrer les saisons
- intégrer la moyenne annuelle
- Créer un graphe des distances à la moyenne
- un Lolipop chart
- intégrer les saisons
Mise en forme de données
Chargeons les données
ad<-"https://hadleyserver.metoffice.gov.uk/hadcet/cetdl1772on.dat"dat<-read.table(ad)colnames(dat)<-c('year','day',paste0('month_',1:12))Chargeons les données
ad<-"https://hadleyserver.metoffice.gov.uk/hadcet/cetdl1772on.dat"dat<-read.table(ad)colnames(dat)<-c('year','day',paste0('month_',1:12))dat %>% slice_head(n=10) year day month_1 month_2 month_3 month_4 month_5 month_6 month_7 month_81 1772 1 32 -15 18 25 87 128 187 1772 1772 2 20 7 28 38 77 138 154 1583 1772 3 27 15 36 33 84 170 139 1534 1772 4 27 -25 61 58 96 90 151 1605 1772 5 15 -5 68 69 133 146 179 1706 1772 6 22 -45 51 77 113 105 175 1987 1772 7 25 12 58 87 106 162 146 1948 1772 8 0 47 46 104 84 181 163 1779 1772 9 0 56 21 87 67 155 179 15510 1772 10 45 28 13 67 59 148 177 153 month_9 month_10 month_11 month_121 105 111 78 1122 143 150 85 623 113 124 83 604 173 114 60 475 173 116 83 506 160 134 134 427 158 114 134 328 135 94 95 559 143 106 70 6210 120 119 122 100Réorganiser les données pour avoir en colonne les années, les jours, les mois et les températures et en ligne les observations réalisées.
Agréger les éléments de date (années, jours, mois) pour créer une variable date.
Limiter la base à la date et au relevé de température.
Mettre la base dans l'ordre des dates.
Mettre en forme la variable de température en éliminant les valeur manquante et en convertissant les valeurs en °C.
Supprimer les valeurs manquantes.
Faisons pivoter l'ensemble
dat%>%pivot_longer(cols=starts_with('month_'), names_to="month", names_prefix='month_', values_to='d_t')# A tibble: 93,000 x 4 year day month d_t <int> <int> <chr> <int> 1 1772 1 1 32 2 1772 1 2 -15 3 1772 1 3 18 4 1772 1 4 25 5 1772 1 5 87 6 1772 1 6 128 7 1772 1 7 187 8 1772 1 8 177 9 1772 1 9 10510 1772 1 10 111# ... with 92,990 more rowsFaisons pivoter l'ensemble
dat%>%pivot_longer(cols=starts_with('month_'), names_to="month", names_prefix='month_', values_to='d_t') %>% mutate(date=as.Date(paste0(day,'/',month,'/',year), format='%d/%m/%Y', origin='1/1/1990'))# A tibble: 93,000 x 5 year day month d_t date <int> <int> <chr> <int> <date> 1 1772 1 1 32 1772-01-01 2 1772 1 2 -15 1772-02-01 3 1772 1 3 18 1772-03-01 4 1772 1 4 25 1772-04-01 5 1772 1 5 87 1772-05-01 6 1772 1 6 128 1772-06-01 7 1772 1 7 187 1772-07-01 8 1772 1 8 177 1772-08-01 9 1772 1 9 105 1772-09-0110 1772 1 10 111 1772-10-01# ... with 92,990 more rowsFaisons pivoter l'ensemble
dat%>%pivot_longer(cols=starts_with('month_'), names_to="month", names_prefix='month_', values_to='d_t') %>% mutate(date=as.Date(paste0(day,'/',month,'/',year), format='%d/%m/%Y', origin='1/1/1990')) %>% select(date,d_t)# A tibble: 93,000 x 2 date d_t <date> <int> 1 1772-01-01 32 2 1772-02-01 -15 3 1772-03-01 18 4 1772-04-01 25 5 1772-05-01 87 6 1772-06-01 128 7 1772-07-01 187 8 1772-08-01 177 9 1772-09-01 10510 1772-10-01 111# ... with 92,990 more rowsFaisons pivoter l'ensemble
dat%>%pivot_longer(cols=starts_with('month_'), names_to="month", names_prefix='month_', values_to='d_t') %>% mutate(date=as.Date(paste0(day,'/',month,'/',year), format='%d/%m/%Y', origin='1/1/1990')) %>% select(date,d_t)%>% arrange(date)# A tibble: 93,000 x 2 date d_t <date> <int> 1 1772-01-01 32 2 1772-01-02 20 3 1772-01-03 27 4 1772-01-04 27 5 1772-01-05 15 6 1772-01-06 22 7 1772-01-07 25 8 1772-01-08 0 9 1772-01-09 010 1772-01-10 45# ... with 92,990 more rowsFaisons pivoter l'ensemble
dat%>%pivot_longer(cols=starts_with('month_'), names_to="month", names_prefix='month_', values_to='d_t') %>% mutate(date=as.Date(paste0(day,'/',month,'/',year), format='%d/%m/%Y', origin='1/1/1990')) %>% select(date,d_t)%>% arrange(date) %>% mutate(d_t=ifelse(d_t==-999,NA,d_t), degre_C=d_t/10)# A tibble: 93,000 x 3 date d_t degre_C <date> <int> <dbl> 1 1772-01-01 32 3.2 2 1772-01-02 20 2 3 1772-01-03 27 2.7 4 1772-01-04 27 2.7 5 1772-01-05 15 1.5 6 1772-01-06 22 2.2 7 1772-01-07 25 2.5 8 1772-01-08 0 0 9 1772-01-09 0 0 10 1772-01-10 45 4.5# ... with 92,990 more rowsFaisons pivoter l'ensemble
dat%>%pivot_longer(cols=starts_with('month_'), names_to="month", names_prefix='month_', values_to='d_t') %>% mutate(date=as.Date(paste0(day,'/',month,'/',year), format='%d/%m/%Y', origin='1/1/1990')) %>% select(date,d_t)%>% arrange(date) %>% mutate(d_t=ifelse(d_t==-999,NA,d_t), degre_C=d_t/10) %>% filter(is.na(d_t)==FALSE)# A tibble: 91,250 x 3 date d_t degre_C <date> <int> <dbl> 1 1772-01-01 32 3.2 2 1772-01-02 20 2 3 1772-01-03 27 2.7 4 1772-01-04 27 2.7 5 1772-01-05 15 1.5 6 1772-01-06 22 2.2 7 1772-01-07 25 2.5 8 1772-01-08 0 0 9 1772-01-09 0 0 10 1772-01-10 45 4.5# ... with 91,240 more rowsFaisons pivoter l'ensemble
dat%>%pivot_longer(cols=starts_with('month_'), names_to="month", names_prefix='month_', values_to='d_t') %>% mutate(date=as.Date(paste0(day,'/',month,'/',year), format='%d/%m/%Y', origin='1/1/1990')) %>% select(date,d_t)%>% arrange(date) %>% mutate(d_t=ifelse(d_t==-999,NA,d_t), degre_C=d_t/10) %>% filter(is.na(d_t)==FALSE) %>% select(-d_t) -> dat_Faisons pivoter l'ensemble
dat%>%pivot_longer(cols=starts_with('month_'), names_to="month", names_prefix='month_', values_to='d_t') %>% mutate(date=as.Date(paste0(day,'/',month,'/',year), format='%d/%m/%Y', origin='1/1/1990')) %>% select(date,d_t)%>% arrange(date) %>% mutate(d_t=ifelse(d_t==-999,NA,d_t), degre_C=d_t/10) %>% filter(is.na(d_t)==FALSE) %>% select(-d_t) -> dat_dat_# A tibble: 91,250 x 2 date degre_C <date> <dbl> 1 1772-01-01 3.2 2 1772-01-02 2 3 1772-01-03 2.7 4 1772-01-04 2.7 5 1772-01-05 1.5 6 1772-01-06 2.2 7 1772-01-07 2.5 8 1772-01-08 0 9 1772-01-09 0 10 1772-01-10 4.5# ... with 91,240 more rowsOn a maintenant une série chronologique dates/températures journalières allant du 1er janvier 1772 au 31 octobre 2021.
Notez que, dans la mesure où le Hadley Center met régulièrement à jour la base, il est probable que, si vous essayez de répliquer le code, vous n'ayez pas la même date finale.
Choisissons une année (1975?)
dat_ %>% mutate(annee=lubridate::year(date)) %>% filter(annee==1975) -> dat_75Choisissons une année (1975?)
dat_ %>% mutate(annee=lubridate::year(date)) %>% filter(annee==1975) -> dat_75dat_75# A tibble: 365 x 3 date degre_C annee <date> <dbl> <dbl> 1 1975-01-01 7.5 1975 2 1975-01-02 8.1 1975 3 1975-01-03 8 1975 4 1975-01-04 6.4 1975 5 1975-01-05 7.5 1975 6 1975-01-06 9.4 1975 7 1975-01-07 7.2 1975 8 1975-01-08 7.6 1975 9 1975-01-09 7.9 197510 1975-01-10 8.9 1975# ... with 355 more rowsElaboration du graphe : nuage de points
Le graphe de base
ggplot(dat=dat_75)+aes(x=date,y=degre_C)
Le graphe de base
ggplot(dat=dat_75)+aes(x=date,y=degre_C)+ geom_point()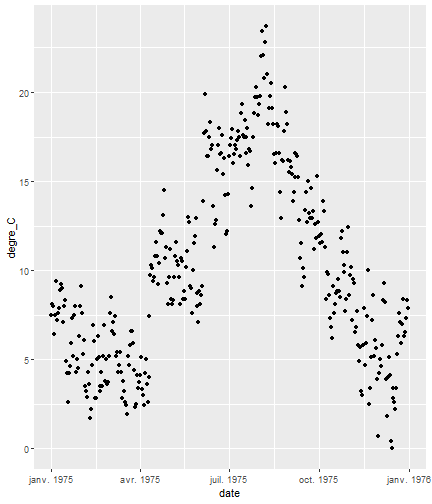
Le graphe de base
ggplot(dat=dat_75)+aes(x=date,y=degre_C)+ geom_point()+ labs(title="Températures moyennes journalières en *1975*", subtitle = "centre de l'Angleterre (en dégrés Celsius)", caption='Données: **centre Hadley** [Parker, Legg et Folland *(1992)*]')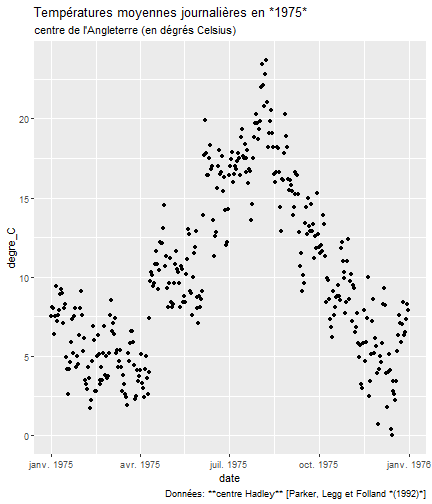
Le graphe de base
ggplot(dat=dat_75)+aes(x=date,y=degre_C)+ geom_point()+ labs(title="Températures moyennes journalières en *1975*", subtitle = "centre de l'Angleterre (en dégrés Celsius)", caption='Données: **centre Hadley** [Parker, Legg et Folland *(1992)*]')+ coord_cartesian(ylim=c(-1,25),expand = FALSE)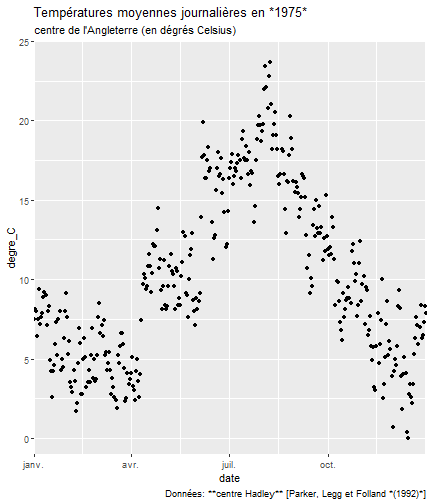
Le graphe de base
ggplot(dat=dat_75)+aes(x=date,y=degre_C)+ geom_point()+ labs(title="Températures moyennes journalières en *1975*", subtitle = "centre de l'Angleterre (en dégrés Celsius)", caption='Données: **centre Hadley** [Parker, Legg et Folland *(1992)*]')+ coord_cartesian(ylim=c(-1,25),expand = FALSE)+ scale_y_continuous(breaks=seq(0,25,5))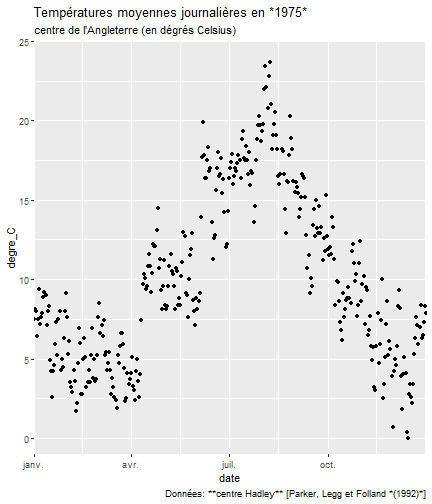
Le graphe de base
ggplot(dat=dat_75)+aes(x=date,y=degre_C)+ geom_point()+ labs(title="Températures moyennes journalières en *1975*", subtitle = "centre de l'Angleterre (en dégrés Celsius)", caption='Données: **centre Hadley** [Parker, Legg et Folland *(1992)*]')+ coord_cartesian(ylim=c(-1,25),expand = FALSE)+ scale_y_continuous(breaks=seq(0,25,5))+ scale_x_date(date_breaks = "1 month", date_labels = "%b")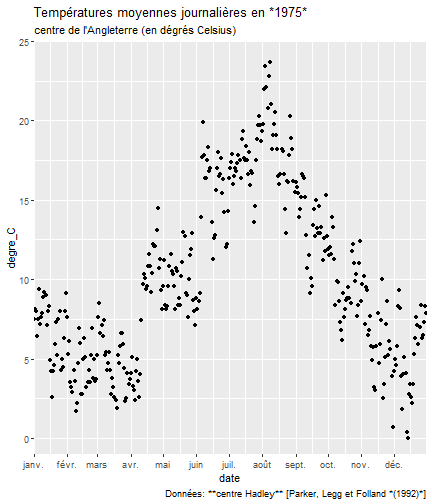
Le graphe de base
ggplot(dat=dat_75)+aes(x=date,y=degre_C)+ geom_point()+ labs(title="Températures moyennes journalières en *1975*", subtitle = "centre de l'Angleterre (en dégrés Celsius)", caption='Données: **centre Hadley** [Parker, Legg et Folland *(1992)*]')+ coord_cartesian(ylim=c(-1,25),expand = FALSE)+ scale_y_continuous(breaks=seq(0,25,5))+ scale_x_date(date_breaks = "1 month", date_labels = "%b")+ theme_minimal()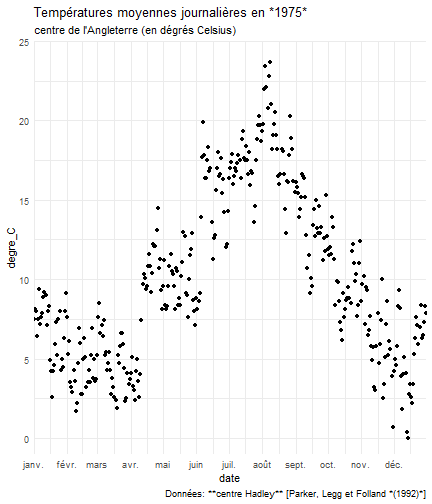
Le graphe de base
ggplot(dat=dat_75)+aes(x=date,y=degre_C)+ geom_point()+ labs(title="Températures moyennes journalières en *1975*", subtitle = "centre de l'Angleterre (en dégrés Celsius)", caption='Données: **centre Hadley** [Parker, Legg et Folland *(1992)*]')+ coord_cartesian(ylim=c(-1,25),expand = FALSE)+ scale_y_continuous(breaks=seq(0,25,5))+ scale_x_date(date_breaks = "1 month", date_labels = "%b")+ theme_minimal()+ theme(axis.title = element_blank(), axis.line = element_line(colour='grey'), panel.grid.major = element_blank(), panel.grid.major.y = element_line(colour='Gainsboro'), panel.grid.minor = element_blank(), plot.title = element_markdown(hjust=0.5,face='bold'), plot.subtitle = element_markdown(hjust=0.5,face='italic'), plot.caption = element_markdown(margin=margin(t=15))) -> plot1Le graphe de base
ggplot(dat=dat_75)+aes(x=date,y=degre_C)+ geom_point()+ labs(title="Températures moyennes journalières en *1975*", subtitle = "centre de l'Angleterre (en dégrés Celsius)", caption='Données: **centre Hadley** [Parker, Legg et Folland *(1992)*]')+ coord_cartesian(ylim=c(-1,25),expand = FALSE)+ scale_y_continuous(breaks=seq(0,25,5))+ scale_x_date(date_breaks = "1 month", date_labels = "%b")+ theme_minimal()+ theme(axis.title = element_blank(), axis.line = element_line(colour='grey'), panel.grid.major = element_blank(), panel.grid.major.y = element_line(colour='Gainsboro'), panel.grid.minor = element_blank(), plot.title = element_markdown(hjust=0.5,face='bold'), plot.subtitle = element_markdown(hjust=0.5,face='italic'), plot.caption = element_markdown(margin=margin(t=15))) -> plot1plot1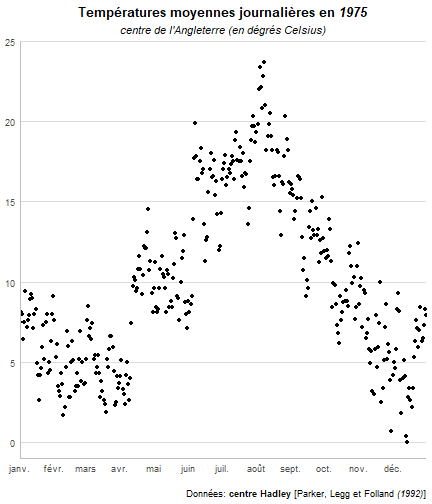
Les saisons
- L' hivers : du 21 décembre au 19 mars -> couleur MintCream
- Le printemps : du 20 mars au 20 juin -> couleur PaleGreen
- L'été : du 21 juin au 22 septembre -> couleur LightYellow
- L'automne : de 23 septembre au 20 décembre -> couleur BurlyWood
Marquons la position des saisons
plot1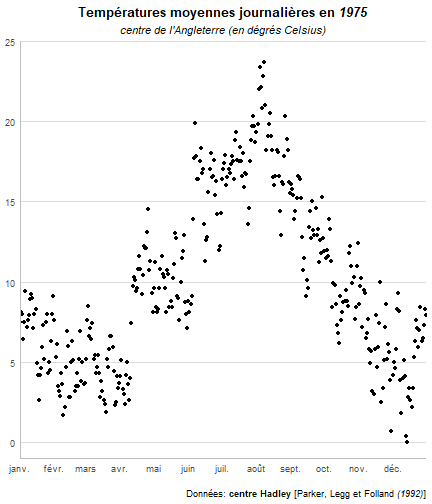
Marquons la position des saisons
plot1+ geom_rect(mapping=aes(xmin=as.Date('1-1-1975',format="%d-%m-%Y"), xmax=as.Date('20-3-1975',format="%d-%m-%Y"), ymin=-1,ymax=25),alpha=0.1,fill='MintCream')+ geom_rect(mapping=aes(xmin=as.Date('21-12-1975',format="%d-%m-%Y"), xmax=as.Date('31-12-1975',format="%d-%m-%Y"), ymin=-1,ymax=25), alpha=0.1,fill='MintCream')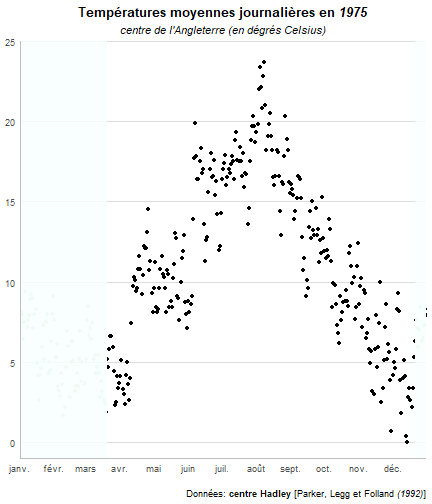
Marquons la position des saisons
plot1+ geom_rect(mapping=aes(xmin=as.Date('1-1-1975',format="%d-%m-%Y"), xmax=as.Date('20-3-1975',format="%d-%m-%Y"), ymin=-1,ymax=25),alpha=0.1,fill='MintCream')+ geom_rect(mapping=aes(xmin=as.Date('21-12-1975',format="%d-%m-%Y"), xmax=as.Date('31-12-1975',format="%d-%m-%Y"), ymin=-1,ymax=25), alpha=0.1,fill='MintCream')+ geom_rect(mapping=aes(xmin=as.Date('21-3-1975',format="%d-%m-%Y"), xmax=as.Date('21-6-1975',format="%d-%m-%Y"), ymin=-1,ymax=25), alpha=0.01,fill='PaleGreen')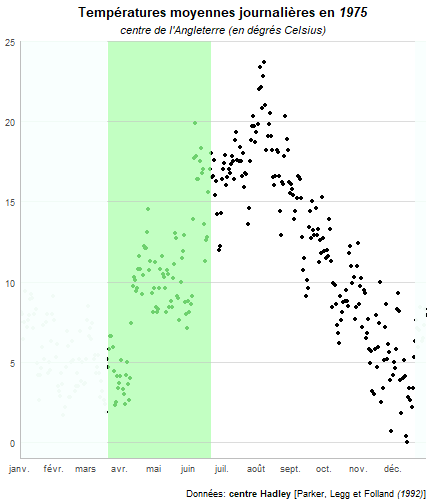
Marquons la position des saisons
plot1+ geom_rect(mapping=aes(xmin=as.Date('1-1-1975',format="%d-%m-%Y"), xmax=as.Date('20-3-1975',format="%d-%m-%Y"), ymin=-1,ymax=25),alpha=0.1,fill='MintCream')+ geom_rect(mapping=aes(xmin=as.Date('21-12-1975',format="%d-%m-%Y"), xmax=as.Date('31-12-1975',format="%d-%m-%Y"), ymin=-1,ymax=25), alpha=0.1,fill='MintCream')+ geom_rect(mapping=aes(xmin=as.Date('21-3-1975',format="%d-%m-%Y"), xmax=as.Date('21-6-1975',format="%d-%m-%Y"), ymin=-1,ymax=25), alpha=0.01,fill='PaleGreen')+ geom_rect(mapping=aes(xmin=as.Date('22-6-1975',format="%d-%m-%Y"), xmax=as.Date('23-9-1975',format="%d-%m-%Y"), ymin=-1,ymax=25), alpha=0.1,fill='LightYellow')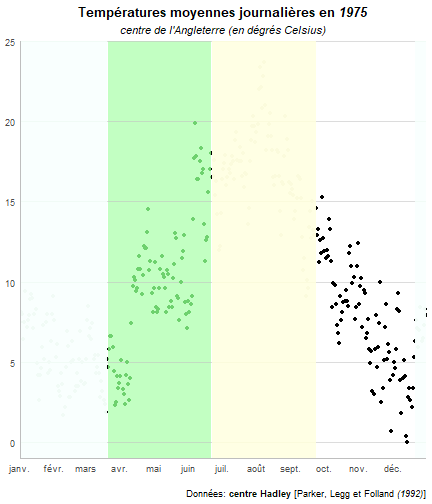
Marquons la position des saisons
plot1+ geom_rect(mapping=aes(xmin=as.Date('1-1-1975',format="%d-%m-%Y"), xmax=as.Date('20-3-1975',format="%d-%m-%Y"), ymin=-1,ymax=25),alpha=0.1,fill='MintCream')+ geom_rect(mapping=aes(xmin=as.Date('21-12-1975',format="%d-%m-%Y"), xmax=as.Date('31-12-1975',format="%d-%m-%Y"), ymin=-1,ymax=25), alpha=0.1,fill='MintCream')+ geom_rect(mapping=aes(xmin=as.Date('21-3-1975',format="%d-%m-%Y"), xmax=as.Date('21-6-1975',format="%d-%m-%Y"), ymin=-1,ymax=25), alpha=0.01,fill='PaleGreen')+ geom_rect(mapping=aes(xmin=as.Date('22-6-1975',format="%d-%m-%Y"), xmax=as.Date('23-9-1975',format="%d-%m-%Y"), ymin=-1,ymax=25), alpha=0.1,fill='LightYellow')+ geom_rect(mapping=aes(xmin=as.Date('24-9-1975',format="%d-%m-%Y"), xmax=as.Date('20-12-1975',format="%d-%m-%Y"), ymin=-1,ymax=25), alpha=0.01,fill='BurlyWood')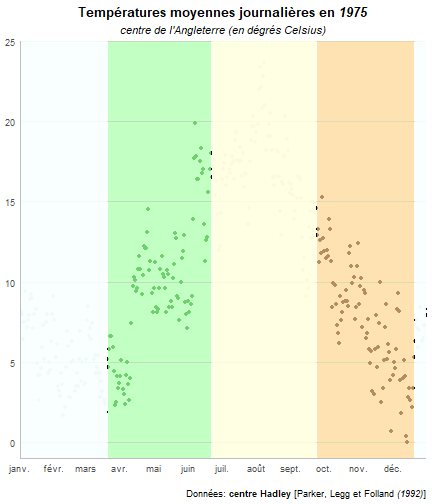
Marquons la position des saisons
plot1+ geom_rect(mapping=aes(xmin=as.Date('1-1-1975',format="%d-%m-%Y"), xmax=as.Date('20-3-1975',format="%d-%m-%Y"), ymin=-1,ymax=25),alpha=0.1,fill='MintCream')+ geom_rect(mapping=aes(xmin=as.Date('21-12-1975',format="%d-%m-%Y"), xmax=as.Date('31-12-1975',format="%d-%m-%Y"), ymin=-1,ymax=25), alpha=0.1,fill='MintCream')+ geom_rect(mapping=aes(xmin=as.Date('21-3-1975',format="%d-%m-%Y"), xmax=as.Date('21-6-1975',format="%d-%m-%Y"), ymin=-1,ymax=25), alpha=0.01,fill='PaleGreen')+ geom_rect(mapping=aes(xmin=as.Date('22-6-1975',format="%d-%m-%Y"), xmax=as.Date('23-9-1975',format="%d-%m-%Y"), ymin=-1,ymax=25), alpha=0.1,fill='LightYellow')+ geom_rect(mapping=aes(xmin=as.Date('24-9-1975',format="%d-%m-%Y"), xmax=as.Date('20-12-1975',format="%d-%m-%Y"), ymin=-1,ymax=25), alpha=0.01,fill='BurlyWood')+ geom_point()-> plot2plot2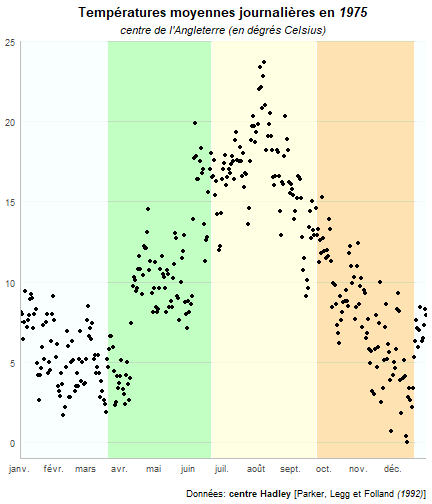
La moyenne
Indiquons la moyenne
plot2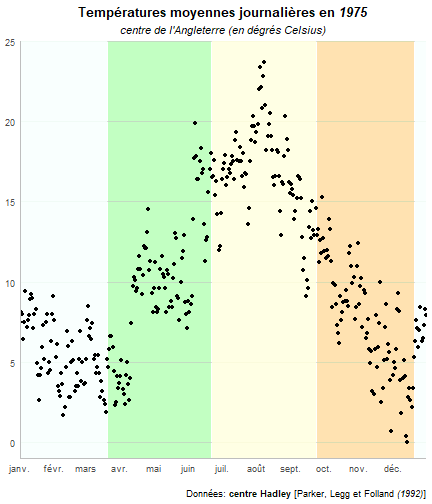
Indiquons la moyenne
plot2+ geom_hline(yintercept = mean(dat_75$degre_C),color='red')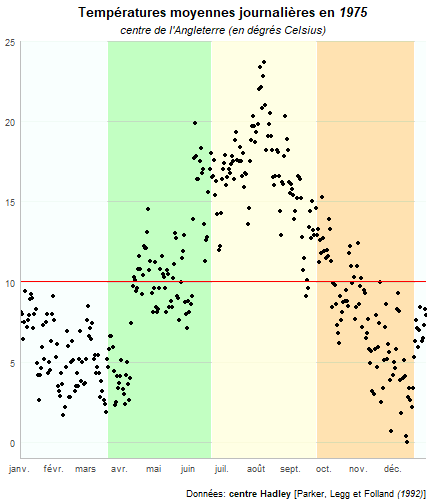
Indiquons la moyenne
plot2+ geom_hline(yintercept = mean(dat_75$degre_C),color='red')+ geom_text(aes(x=as.Date('10-2-1975',format="%d-%m-%Y"),y=10.5), label='Moy.an. 10.03°C',color='red')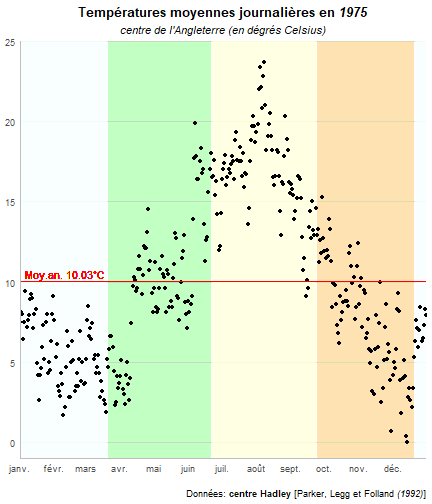
Indiquons la moyenne
plot2+ geom_hline(yintercept = mean(dat_75$degre_C),color='red')+ geom_text(aes(x=as.Date('10-2-1975',format="%d-%m-%Y"),y=10.5), label='Moy.an. 10.03°C',color='red') -> plot3Indiquons la moyenne
plot2+ geom_hline(yintercept = mean(dat_75$degre_C),color='red')+ geom_text(aes(x=as.Date('10-2-1975',format="%d-%m-%Y"),y=10.5), label='Moy.an. 10.03°C',color='red') -> plot3plot3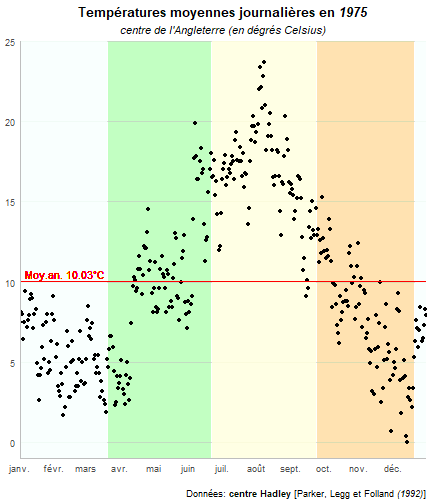
Elaboration du graphe des distances à la moyenne
Préparation des données
Distance à la moyenne
dat_75_d<-dat_75 %>% mutate(dist=degre_C-mean(dat_75$degre_C), pos=as.factor(ifelse(dist<0,'froid','chaud')))Distance à la moyenne
dat_75_d<-dat_75 %>% mutate(dist=degre_C-mean(dat_75$degre_C), pos=as.factor(ifelse(dist<0,'froid','chaud')))dat_75_d# A tibble: 365 x 5 date degre_C annee dist pos <date> <dbl> <dbl> <dbl> <fct> 1 1975-01-01 7.5 1975 -2.54 froid 2 1975-01-02 8.1 1975 -1.94 froid 3 1975-01-03 8 1975 -2.04 froid 4 1975-01-04 6.4 1975 -3.64 froid 5 1975-01-05 7.5 1975 -2.54 froid 6 1975-01-06 9.4 1975 -0.637 froid 7 1975-01-07 7.2 1975 -2.84 froid 8 1975-01-08 7.6 1975 -2.44 froid 9 1975-01-09 7.9 1975 -2.14 froid10 1975-01-10 8.9 1975 -1.14 froid# ... with 355 more rowsElaboration du graphe : Lolipop chart
Création du Lolipop chart
ggplot(data=dat_75_d)
Création du Lolipop chart
ggplot(data=dat_75_d) + aes(x=date,y=dist)
Création du Lolipop chart
ggplot(data=dat_75_d) + aes(x=date,y=dist) + geom_point(aes(color=pos),size=1.5)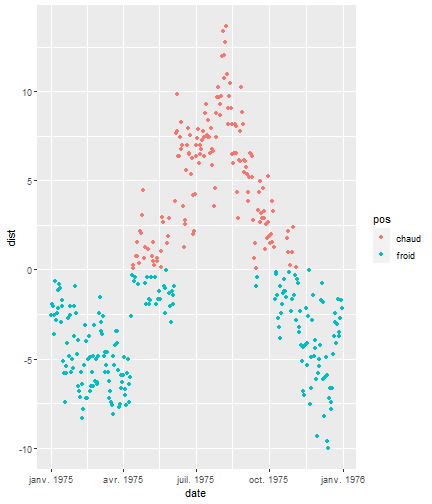
Création du Lolipop chart
ggplot(data=dat_75_d) + aes(x=date,y=dist) + geom_point(aes(color=pos),size=1.5) + geom_segment(aes(xend=date,y=0,yend=dist,color=pos),size=0.01)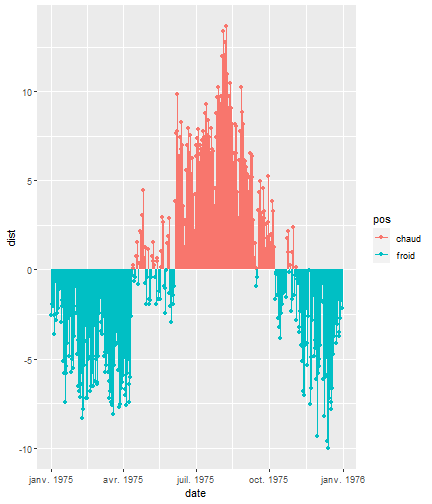
Création du Lolipop chart
ggplot(data=dat_75_d) + aes(x=date,y=dist) + geom_point(aes(color=pos),size=1.5) + geom_segment(aes(xend=date,y=0,yend=dist,color=pos),size=0.01)+ geom_hline(yintercept = 0, color='purple')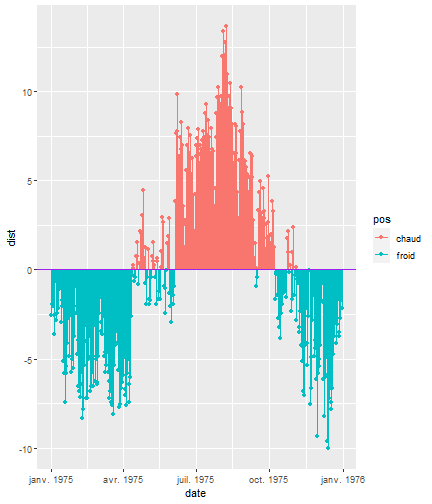
Création du Lolipop chart
ggplot(data=dat_75_d) + aes(x=date,y=dist) + geom_point(aes(color=pos),size=1.5) + geom_segment(aes(xend=date,y=0,yend=dist,color=pos),size=0.01)+ geom_hline(yintercept = 0, color='purple')+ geom_text(aes(x=as.Date('10-2-1975',format="%d-%m-%Y"),y=0.5), label='Moy.an. 10.03°C',color='purple')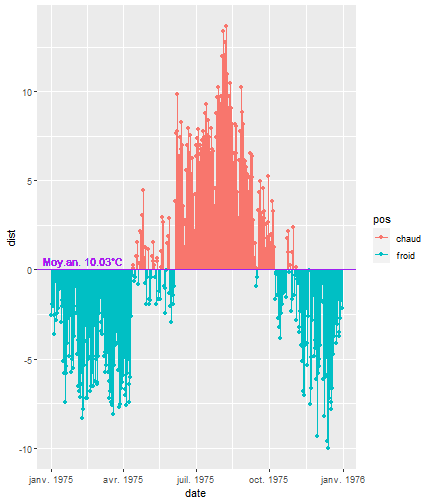
Création du Lolipop chart
ggplot(data=dat_75_d) + aes(x=date,y=dist) + geom_point(aes(color=pos),size=1.5) + geom_segment(aes(xend=date,y=0,yend=dist,color=pos),size=0.01)+ geom_hline(yintercept = 0, color='purple')+ geom_text(aes(x=as.Date('10-2-1975',format="%d-%m-%Y"),y=0.5), label='Moy.an. 10.03°C',color='purple')+ labs(title="Lollipop chart des temépératures moyennes (pour l'année 1975)", subtitle = "centre de l'Angleterre", caption='Données: **centre Hadley** [Parker, Legg et Folland *(1992)*]', y='écart par rapport à la moyenne annuelle (en °C)')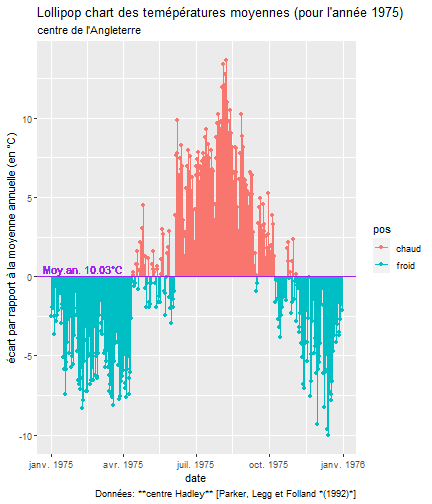
Création du Lolipop chart
ggplot(data=dat_75_d) + aes(x=date,y=dist) + geom_point(aes(color=pos),size=1.5) + geom_segment(aes(xend=date,y=0,yend=dist,color=pos),size=0.01)+ geom_hline(yintercept = 0, color='purple')+ geom_text(aes(x=as.Date('10-2-1975',format="%d-%m-%Y"),y=0.5), label='Moy.an. 10.03°C',color='purple')+ labs(title="Lollipop chart des temépératures moyennes (pour l'année 1975)", subtitle = "centre de l'Angleterre", caption='Données: **centre Hadley** [Parker, Legg et Folland *(1992)*]', y='écart par rapport à la moyenne annuelle (en °C)')+ coord_cartesian(ylim=c(-12,15),expand = FALSE)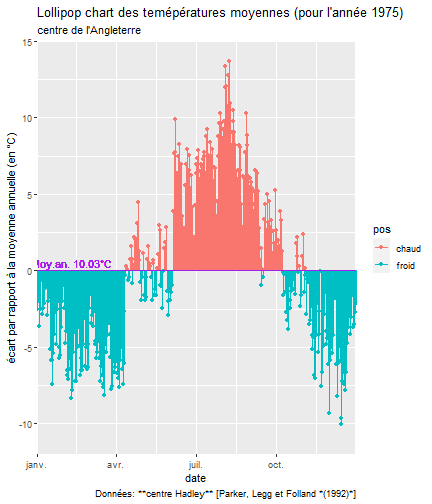
Création du Lolipop chart
ggplot(data=dat_75_d) + aes(x=date,y=dist) + geom_point(aes(color=pos),size=1.5) + geom_segment(aes(xend=date,y=0,yend=dist,color=pos),size=0.01)+ geom_hline(yintercept = 0, color='purple')+ geom_text(aes(x=as.Date('10-2-1975',format="%d-%m-%Y"),y=0.5), label='Moy.an. 10.03°C',color='purple')+ labs(title="Lollipop chart des temépératures moyennes (pour l'année 1975)", subtitle = "centre de l'Angleterre", caption='Données: **centre Hadley** [Parker, Legg et Folland *(1992)*]', y='écart par rapport à la moyenne annuelle (en °C)')+ coord_cartesian(ylim=c(-12,15),expand = FALSE)+ scale_x_date(date_breaks = "1 month", date_labels = "%b")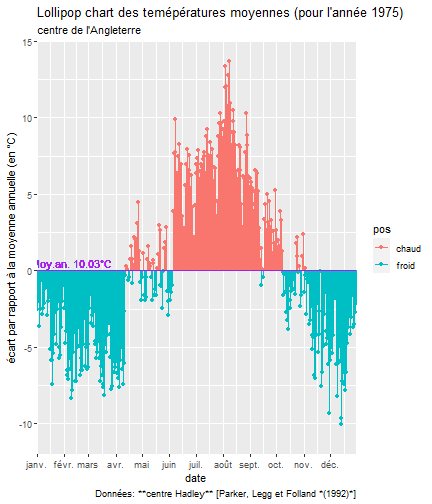
Création du Lolipop chart
ggplot(data=dat_75_d) + aes(x=date,y=dist) + geom_point(aes(color=pos),size=1.5) + geom_segment(aes(xend=date,y=0,yend=dist,color=pos),size=0.01)+ geom_hline(yintercept = 0, color='purple')+ geom_text(aes(x=as.Date('10-2-1975',format="%d-%m-%Y"),y=0.5), label='Moy.an. 10.03°C',color='purple')+ labs(title="Lollipop chart des temépératures moyennes (pour l'année 1975)", subtitle = "centre de l'Angleterre", caption='Données: **centre Hadley** [Parker, Legg et Folland *(1992)*]', y='écart par rapport à la moyenne annuelle (en °C)')+ coord_cartesian(ylim=c(-12,15),expand = FALSE)+ scale_x_date(date_breaks = "1 month", date_labels = "%b")+ scale_y_continuous(breaks=seq(-10,20,5))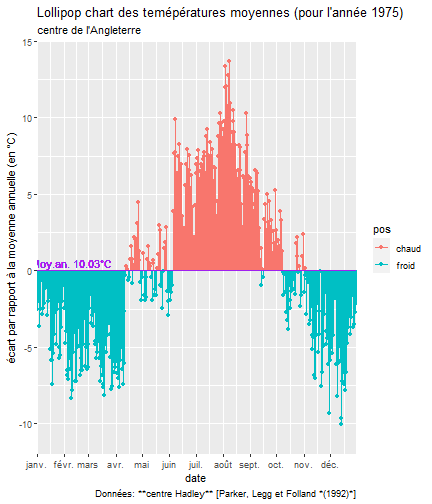
Création du Lolipop chart
ggplot(data=dat_75_d) + aes(x=date,y=dist) + geom_point(aes(color=pos),size=1.5) + geom_segment(aes(xend=date,y=0,yend=dist,color=pos),size=0.01)+ geom_hline(yintercept = 0, color='purple')+ geom_text(aes(x=as.Date('10-2-1975',format="%d-%m-%Y"),y=0.5), label='Moy.an. 10.03°C',color='purple')+ labs(title="Lollipop chart des temépératures moyennes (pour l'année 1975)", subtitle = "centre de l'Angleterre", caption='Données: **centre Hadley** [Parker, Legg et Folland *(1992)*]', y='écart par rapport à la moyenne annuelle (en °C)')+ coord_cartesian(ylim=c(-12,15),expand = FALSE)+ scale_x_date(date_breaks = "1 month", date_labels = "%b")+ scale_y_continuous(breaks=seq(-10,20,5))+ theme_minimal()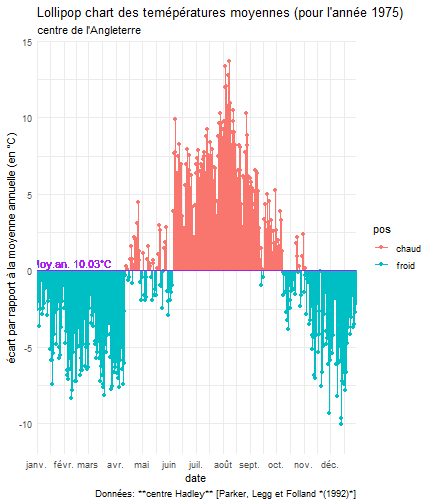
Création du Lolipop chart
ggplot(data=dat_75_d) + aes(x=date,y=dist) + geom_point(aes(color=pos),size=1.5) + geom_segment(aes(xend=date,y=0,yend=dist,color=pos),size=0.01)+ geom_hline(yintercept = 0, color='purple')+ geom_text(aes(x=as.Date('10-2-1975',format="%d-%m-%Y"),y=0.5), label='Moy.an. 10.03°C',color='purple')+ labs(title="Lollipop chart des temépératures moyennes (pour l'année 1975)", subtitle = "centre de l'Angleterre", caption='Données: **centre Hadley** [Parker, Legg et Folland *(1992)*]', y='écart par rapport à la moyenne annuelle (en °C)')+ coord_cartesian(ylim=c(-12,15),expand = FALSE)+ scale_x_date(date_breaks = "1 month", date_labels = "%b")+ scale_y_continuous(breaks=seq(-10,20,5))+ theme_minimal()+ theme(plot.title = element_markdown(hjust=0.5,face='bold'), plot.subtitle = element_markdown(hjust=0.5,face='italic'), plot.caption = element_markdown(margin=margin(t=15)), axis.line = element_line(colour='grey'), axis.title.x = element_blank(), legend.position = 'none')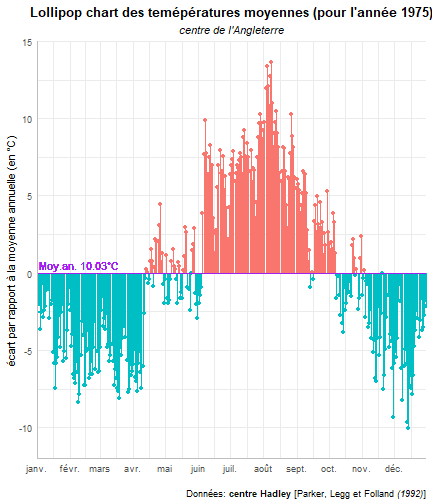
Création du Lolipop chart
ggplot(data=dat_75_d) + aes(x=date,y=dist) + geom_point(aes(color=pos),size=1.5) + geom_segment(aes(xend=date,y=0,yend=dist,color=pos),size=0.01)+ geom_hline(yintercept = 0, color='purple')+ geom_text(aes(x=as.Date('10-2-1975',format="%d-%m-%Y"),y=0.5), label='Moy.an. 10.03°C',color='purple')+ labs(title="Lollipop chart des temépératures moyennes (pour l'année 1975)", subtitle = "centre de l'Angleterre", caption='Données: **centre Hadley** [Parker, Legg et Folland *(1992)*]', y='écart par rapport à la moyenne annuelle (en °C)')+ coord_cartesian(ylim=c(-12,15),expand = FALSE)+ scale_x_date(date_breaks = "1 month", date_labels = "%b")+ scale_y_continuous(breaks=seq(-10,20,5))+ theme_minimal()+ theme(plot.title = element_markdown(hjust=0.5,face='bold'), plot.subtitle = element_markdown(hjust=0.5,face='italic'), plot.caption = element_markdown(margin=margin(t=15)), axis.line = element_line(colour='grey'), axis.title.x = element_blank(), legend.position = 'none') -> plot4Création du Lolipop chart
ggplot(data=dat_75_d) + aes(x=date,y=dist) + geom_point(aes(color=pos),size=1.5) + geom_segment(aes(xend=date,y=0,yend=dist,color=pos),size=0.01)+ geom_hline(yintercept = 0, color='purple')+ geom_text(aes(x=as.Date('10-2-1975',format="%d-%m-%Y"),y=0.5), label='Moy.an. 10.03°C',color='purple')+ labs(title="Lollipop chart des temépératures moyennes (pour l'année 1975)", subtitle = "centre de l'Angleterre", caption='Données: **centre Hadley** [Parker, Legg et Folland *(1992)*]', y='écart par rapport à la moyenne annuelle (en °C)')+ coord_cartesian(ylim=c(-12,15),expand = FALSE)+ scale_x_date(date_breaks = "1 month", date_labels = "%b")+ scale_y_continuous(breaks=seq(-10,20,5))+ theme_minimal()+ theme(plot.title = element_markdown(hjust=0.5,face='bold'), plot.subtitle = element_markdown(hjust=0.5,face='italic'), plot.caption = element_markdown(margin=margin(t=15)), axis.line = element_line(colour='grey'), axis.title.x = element_blank(), legend.position = 'none') -> plot4plot4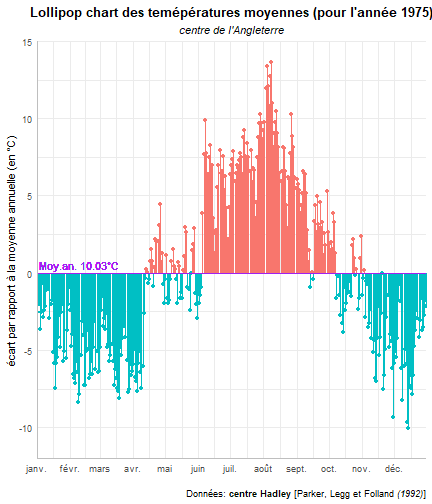
Marquer les saisons
Intégrations des saisons
plot4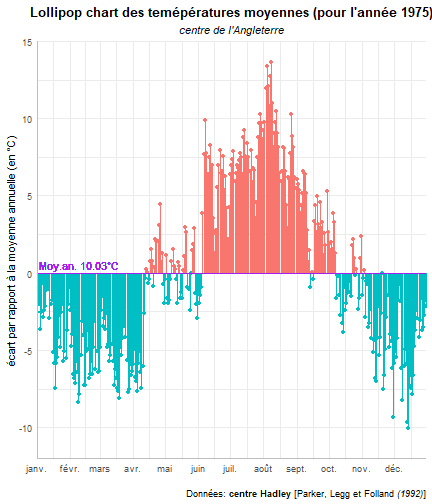
Intégrations des saisons
plot4 + geom_vline(xintercept = as.Date('20-3-1975',format="%d-%m-%Y"), linetype='dashed')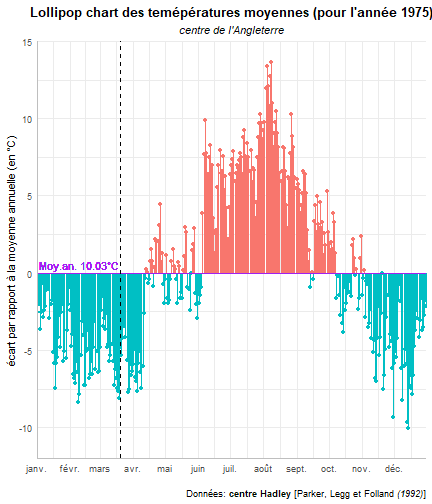
Intégrations des saisons
plot4 + geom_vline(xintercept = as.Date('20-3-1975',format="%d-%m-%Y"), linetype='dashed')+ geom_vline(xintercept = as.Date('21-6-1975',format="%d-%m-%Y"), linetype='dashed')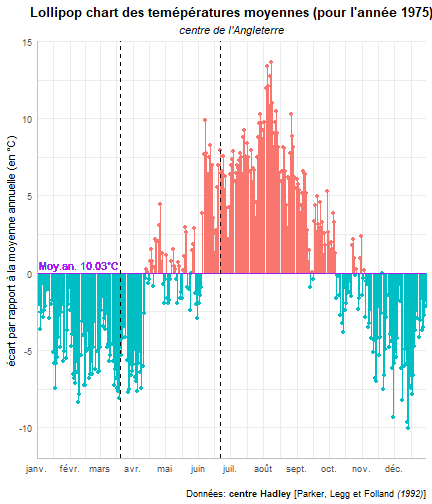
Intégrations des saisons
plot4 + geom_vline(xintercept = as.Date('20-3-1975',format="%d-%m-%Y"), linetype='dashed')+ geom_vline(xintercept = as.Date('21-6-1975',format="%d-%m-%Y"), linetype='dashed')+ geom_vline(xintercept = as.Date('23-9-1975',format="%d-%m-%Y"), linetype='dashed')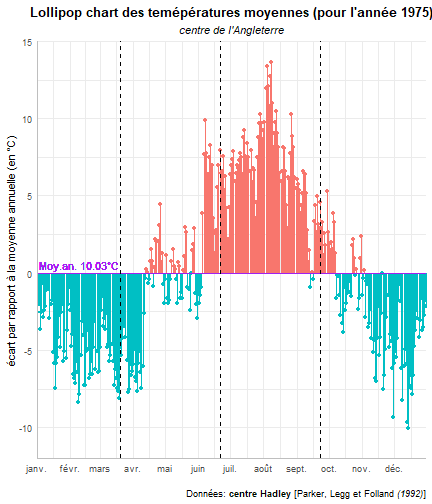
Intégrations des saisons
plot4 + geom_vline(xintercept = as.Date('20-3-1975',format="%d-%m-%Y"), linetype='dashed')+ geom_vline(xintercept = as.Date('21-6-1975',format="%d-%m-%Y"), linetype='dashed')+ geom_vline(xintercept = as.Date('23-9-1975',format="%d-%m-%Y"), linetype='dashed')+ geom_vline(xintercept = as.Date('20-12-1975',format="%d-%m-%Y"), linetype='dashed')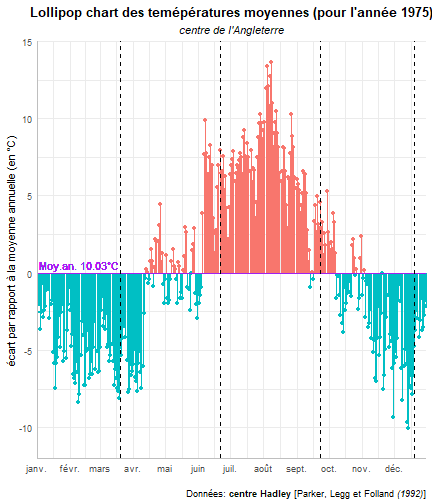
Intégrations des saisons
plot4 + geom_vline(xintercept = as.Date('20-3-1975',format="%d-%m-%Y"), linetype='dashed')+ geom_vline(xintercept = as.Date('21-6-1975',format="%d-%m-%Y"), linetype='dashed')+ geom_vline(xintercept = as.Date('23-9-1975',format="%d-%m-%Y"), linetype='dashed')+ geom_vline(xintercept = as.Date('20-12-1975',format="%d-%m-%Y"), linetype='dashed') -> plot5Intégrations des saisons
plot4 + geom_vline(xintercept = as.Date('20-3-1975',format="%d-%m-%Y"), linetype='dashed')+ geom_vline(xintercept = as.Date('21-6-1975',format="%d-%m-%Y"), linetype='dashed')+ geom_vline(xintercept = as.Date('23-9-1975',format="%d-%m-%Y"), linetype='dashed')+ geom_vline(xintercept = as.Date('20-12-1975',format="%d-%m-%Y"), linetype='dashed') -> plot5plot5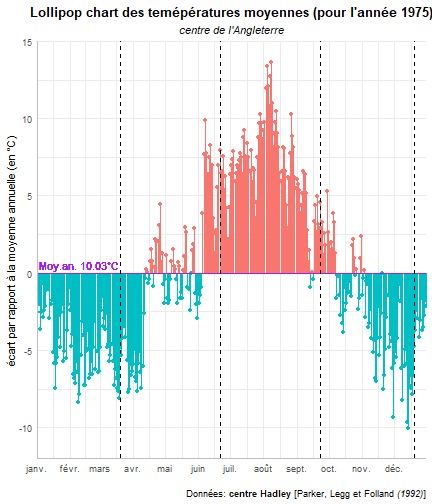
Les graphes réalisés
